Black Joomla
Free Joomla Template Joomla Extensions
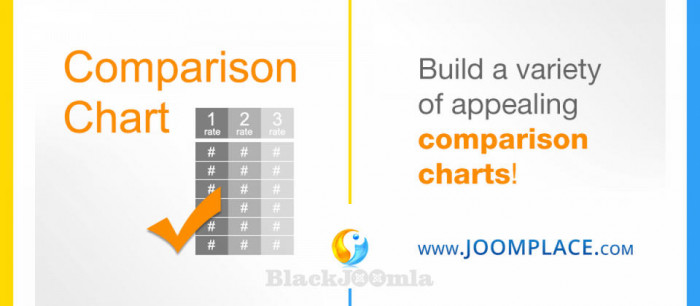
Build comparison charts both for e-Commerce and e-Learning.

Create graphs as pie, doughnut, bar or line charts. With Aimy Charts you can easily visualize data on your website.

It divides a circle into multiple slices that are proportional to their contribution towards the total sum. It is useful in comparing the share or proportion of various items. It is interactive, responsive, cross-browser compatible, supports animation.

JUX Cryptocurrency Ticker is a complete solution for nicely displaying real-time prices, changes, market cap, volume, coin charts, and updates of more than 1500 cryptocurrencies in multi-styles on your Joomla site. The fascinating module quickly grabs data from major cryptocurrencies exchanges using coincap.io APIs to show current market prices.

Team Chart is a unique extension to generate flow chart for companies. Usually building a flow chart require some HTML/CSS knowledge to build something beautiful. With team chart component you can generate one or several flow chart in few minutes directly from an article unsing an AJAX building tool

jDBexport allows you to deliver any data from your databases (JOOMLA and others) as Excel documents directly to your users.
Write any valid SQL query in the administration of this component and combine such queries into multiple Excel worksheets/workbooks

Fabrik is THE open source Joomla! application builder component.

vChart offers you the possibilities to convert your data from Local / Remote Database tables, CSV files / Feeds, Inputted manually into Powerful charts or tables.

Org Chart Tool is organizational chart with many options to display hierarchical charts, organizational structures and sets of nested elements

ARI Data Tables module converts HTML tables into powerful and functional tables with possibilities to sort, filter and paging data. It can also create different charts based on data from tables.
The extension can load data from SQL databases and CSV files.
