Black Joomla
Free Joomla Template Joomla Extensions
Tabulizer provides all the functionality to read data from various sources (typed plain text, Excel and CSV files, Web/HTML pages, RSS Feeds, Database Queries/Tables) and present them in various formats, such as responsive tables, graphs, charts, galleries, event calendars, etc
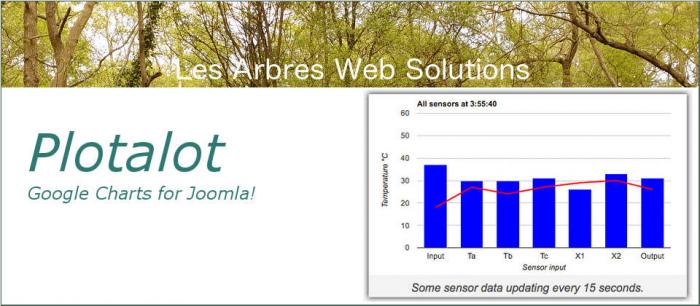
If you can write the SQL to extract the data you want to plot, Plotalot will use the Google Visualization API to dynamically draw various different charts or tables, with numerous formatting options.
