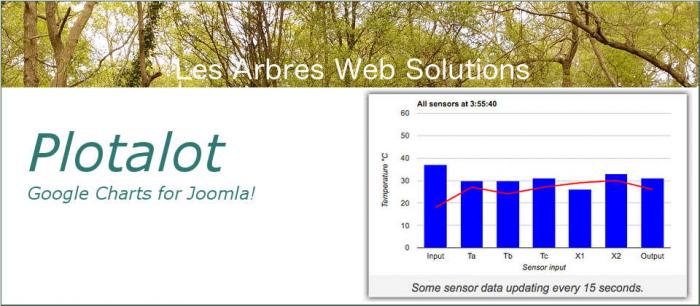
* Line graphs, scatter graphs, and area graphs with multiple plots
* Horizontal or vertical stacked or grouped bar charts
* 2D or 3D pie charts
* Gauges, timelines, bubble charts
* Combo charts
* Candlestick charts
* Legend at top, bottom, left, right, or none
* Optional grid
* Titles and axis labels can be simple text or SQL queries
* Axis limits can be automatic, fixed, or SQL generated
* Charts can be responsive.
* Charts can refresh automatically without re-drawing the whole page
* SQL can include various types of variables
* Query the local site database or any other supported database
* Can also produce tables or single items
* No libraries to install, just a component and an optional plugin
* Charts can be cached on your web-server to reduce database load
* Plotalot can be built in to your own code to add charting to your own components
Usage is fully documented in a free PDF user guide.
Download
Login to Download - Registration is Free in BlackJoomla but you should have points for download - FAQ
If after login, appears Warning (The security token did not match...) please refresh page and login again
Message
Before send Article, Video, contribution Please study FAQ
All of files compressed by WinRAR - use from Latest WinRAR before install
Password for all files:BlackJoomla.com


